Dashboards are a key component in the analytics process because they provide a compact overview of information in a digestible form for various stakeholders. The ultimate goal of a dashboard is to help its users make optimal decisions and use this ever-growing pool of data to their advantage. This checklist contains key information to keep in mind when designing your following dashboard.
Know your dashboard type
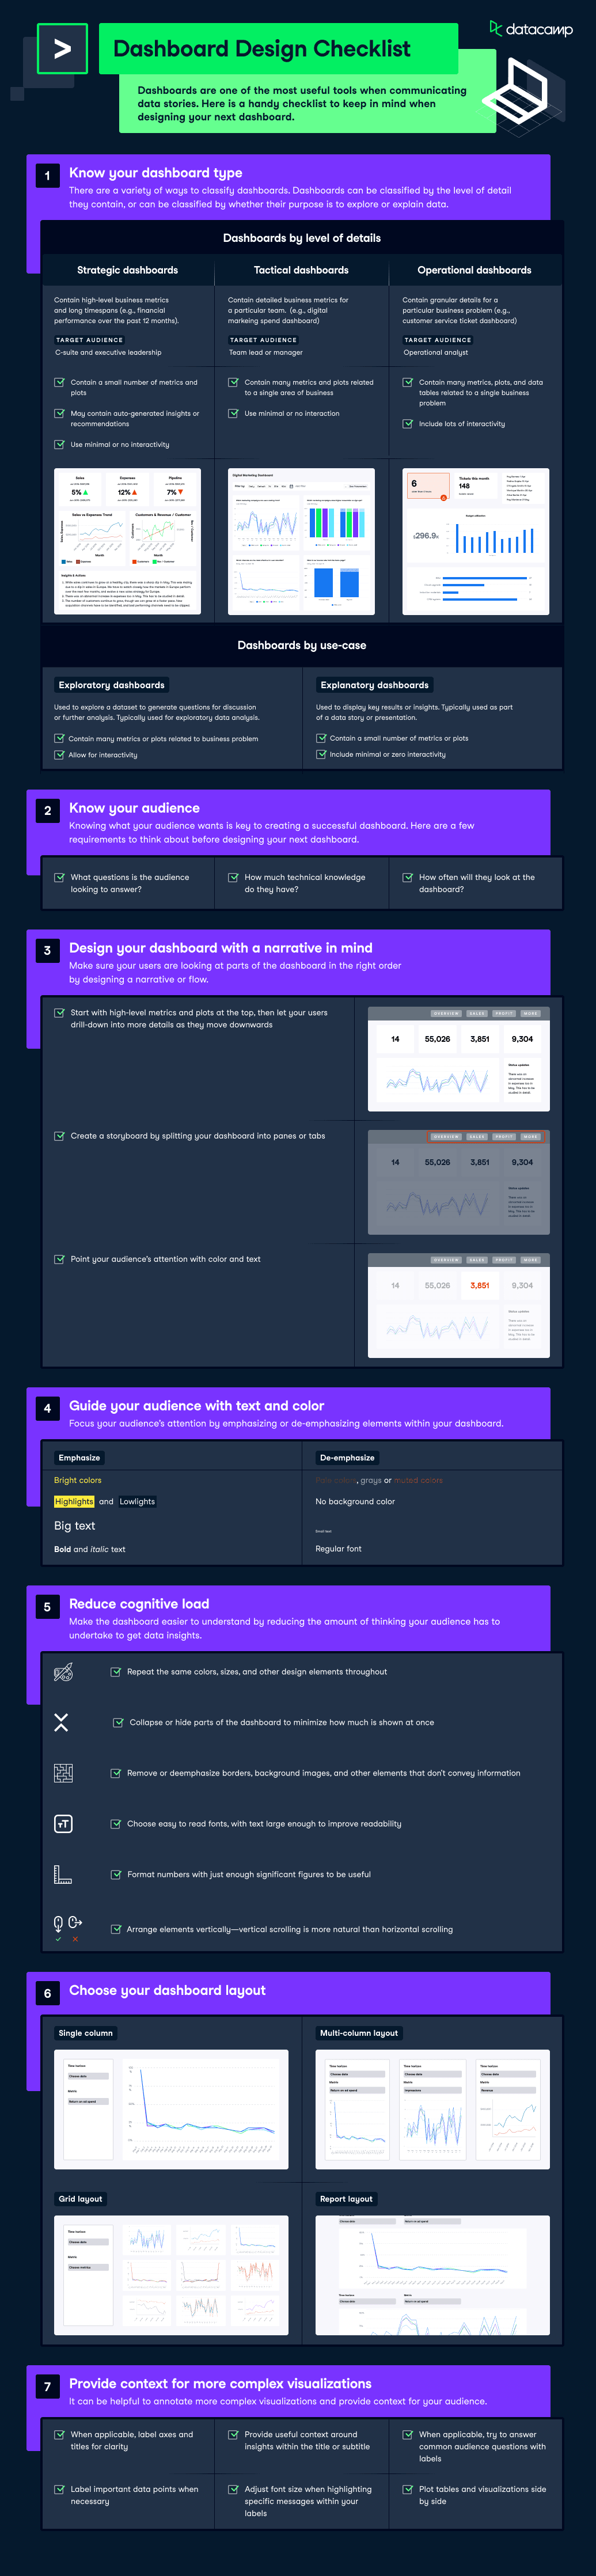
There are a variety of ways to classify dashboards. Dashboards can be classified by the level of detail they contain or by whether their purpose is to explore or explain data.
Dashboards by the level of details
- Strategic dashboards: Contain high-level business metrics and long timespans (e.g., financial performance over the past 12 months)—best fit for c-suite and executive leadership.
- Tactical dashboards: Contain detailed business metrics for a particular team. (e.g., digital markeing spend dashboard). Best suited for a team lead or manager.
- Operational dashboards: Contain granular details for a particular business problem (e.g., customer service ticket dashboard). Best suited for analysts on the ground.
Dashboards by use-case
- Exploratory dashboards: Used to explore a dataset to generate questions for discussion or further analysis. Typically used for exploratory data analysis.
- Explanatory dashboards: Used to display key results or insights. Typically used as part of a data story or presentation.
Know your audience
Knowing what your audience wants is key to creating a successful dashboard. Here are a few requirements to think about before designing your following dashboard. Key questions to ask:
- What questions is the audience looking to answer?
- How much technical knowledge do they have?
- How often will they look at the dashboard?
Design your dashboard with a narrative in mind
Make sure your users look at the dashboard parts in the correct order by designing a narrative or flow. Here are some considerations when designing a dashboard with a narrative in mind.
- Start with high-level metrics and plots at the top, then let your users drill down into more details as they move downwards.
- Create a storyboard by splitting your dashboard into panes or tabs.